
From World Health Organization – On 31 December 2019, WHO was alerted to several cases of pneumonia in Wuhan City, Hubei Province of China. Since then Corona Virus is spreading across the globe. In this project ” VISUALIZING & PREDICTING CORONA CASES”, we will be using a dataset from Our World in Data.
Here we will be visualizing the current trend of cases and trends in Asia, especially in Nepal(You can choose your own country). So, let’s begin the project by importing the dataset & other libraries.
Code :
covid_data_countrydate = covid_data[covid_data['new_cases']>0]
covid_data_countrydate = covid_data_countrydate.groupby(['date','location']).sum().reset_index()
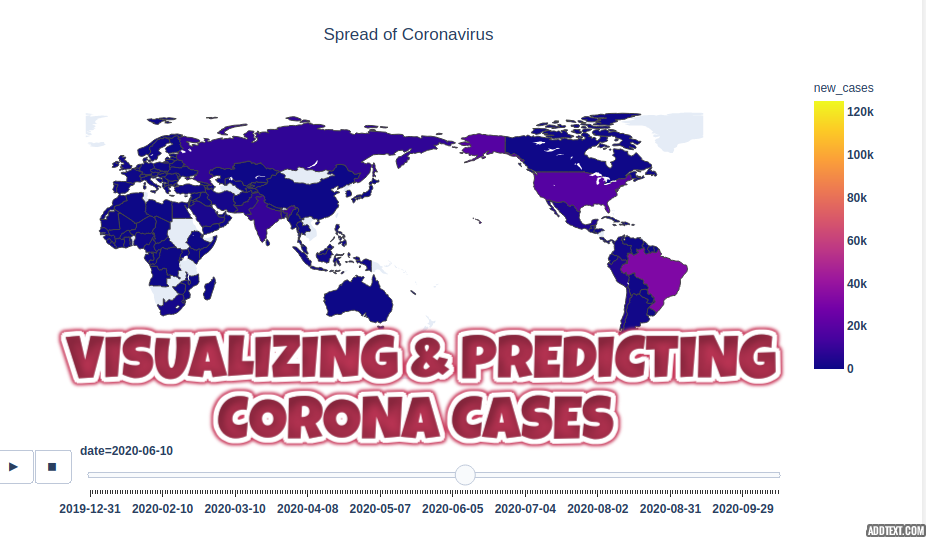
fig = px.choropleth(covid_data_countrydate,
locations="location",
locationmode = "country names",
color="new_cases",
hover_name="location",
animation_frame="date"
)
fig.update_layout(
title_text = 'Spread of Coronavirus',
title_x = 0.5,
geo=dict(
showframe = False,
showcoastlines = False,
))
fig.show()
VISUALIZING CASES IN ASIA REGION
Here, we are visualizing the corona datasets only from Asia. So, we will be selecting datasets related to the Asia continent only. We will be grouping the datasets by country name i.e location and date. Now, we will visualize the cureent corona cases in the Asia region as of October 13.
Code
#selecting only Asia Region
covid_data1=covid_data.loc[covid_data['continent'] == 'Asia']
#grouping by data & location whose corona cases> 0
covid = covid_data1.groupby(['location', 'date']).max().reset_index().sort_values('date', ascending=False)
covid = covid.drop_duplicates(subset = ['location'])
covid = covid[covid['total_cases']>0]
#visualizing Corona Cases on October 13 in Asia Region
fig = go.Figure(data=go.Choropleth(
locations = covid['location'],
locationmode = 'country names',
z = covid['new_cases'],
colorscale = 'Reds',
marker_line_color = 'black',
marker_line_width = 0.5
))
fig.update_layout(
title_text = 'New cases As of October 13 : Asia',
title_x = 0.5,
geo=dict(
showframe = False,
showcoastlines = False,
projection_type = 'equirectangular'
)
)
*Beware click the link!
 Djie sam soe
 Murtad methamphetamine
 Sandidi
 ImamWawe